
M.AX Platform
QFactory
M.AX Platform
QFactory
Process, equipment, quality and energy data joined into one — predicting faults and waste, and pointing to the right action.
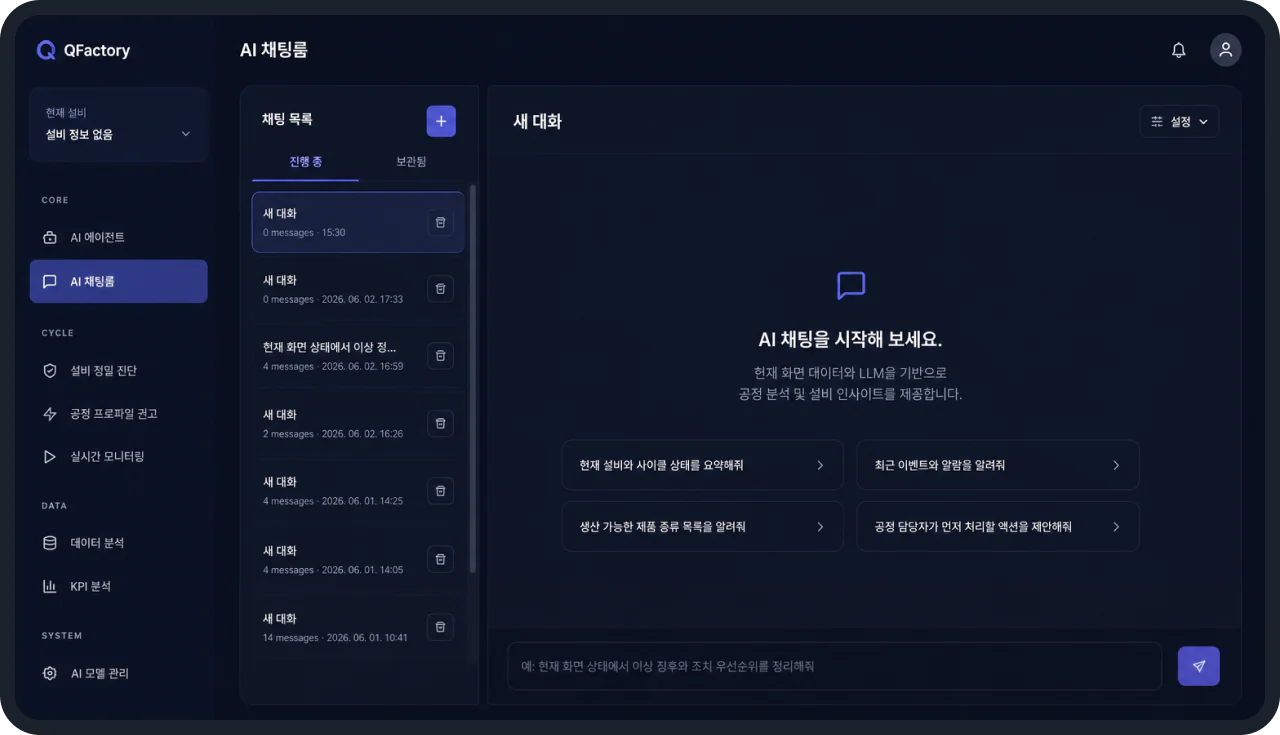
Overview
Not one machine — the whole plant
QFactory leaves your equipment as it is, gathers data from the processes that matter, and carries predictions through into action on the line.

Live monitoring and anomaly detection
Equipment and flow watched continuously, so departures from normal surface early — with likely causes
Predictive maintenance and quality
Failure likelihood, remaining useful life and quality drift predicted, pointing to when to inspect and what to do
Production and energy optimisation
Process conditions and energy use analysed, with operating settings recommended for better output and efficiencyManufacturing AX
Six AI capabilities across the whole of plant operation
Start with whichever fits the problem, then widen the proven scope step by step.
Adopting it in stagesNothing is ripped out. Add-on sensors and edge systems sit alongside what you have, and coverage grows from the process that needs it most.
Unifying plant data for AI
Control, quality and production systems and sensor data, aligned by time, job and machine.
- Data joined
- Process · equipment · quality · energy · logistics
- How it is used
- Consistency checks, root-cause tracing, and standard data for training
Optimising heat generation and use
Heat generation and steam consumption read together, with settings that cut both oversupply and shortfall.
- Data joined
- Combustion · steam · fuel · air · temperature and humidity
- How it is used
- Balancing generation and use across incinerator, boiler and dryer
Equipment health and remaining life
Changes in rotating and drying equipment are read to predict faults, risk and how much life is left.
- Data joined
- Vibration · current · temperature · pressure · flow · maintenance history
- How it is used
- Early warning, maintenance priority, downtime avoided
Quality prediction and supply-chain tracing
From raw material and additive through to final quality, time and lot history are linked to find where the variance came from.
- Data joined
- Concentration · particle size · process settings · inspection · shipping lot
- How it is used
- Quality prediction, root-cause tracing, feedback up the supply chain
Video AI for safety
Video and equipment events read together to detect unsafe behaviour, entry into restricted areas, fire and other incidents.
- Data joined
- Live video streams (RTSP) · work zones · equipment alarms
- How it is used
- Alerts by severity, history, false-alarm feedback
Running the models, widening autonomy
Training, deployment and accuracy are managed, and recommend → approve → act → check runs as one flow.
- What is tracked
- Model and data versions, accuracy, and shifts in the data
- How it is used
- Continuous retraining and rollback, edge integration, and autonomy widened in steps
Features
From diagnosing the process to running the models
Equipment, process, operations and performance data analysed and improved as one flow.
Detect
Detailed equipment diagnosis
Vacuum pumps, heaters, vibration and temperature sensors are read to find risk and early warning signs before the run.
- Health assessment
- One combined verdict across pumps, heaters, vibration and temperature
- Reviewing the verdict
- A person separates false alarms from real faults
- Moving on safely
- Only approved findings carry into process design and live monitoring
Recommend
Recommending the process recipe
Product, loading and past results are analysed to propose the best operating profile, stage by stage.
- Entering the conditions
- Product, weight, thickness and the rest
- Generating the profile
- Target temperature and hold time designed from successful cycles and AI prediction
- Applied only on approval
- The reasoning and expected outcome are shown, and a person accepts or declines
Monitor
Live process monitoring
A 3D view of the equipment, with temperature, current and vacuum trends, watches the process as it runs.
- Many signals at once
- Temperature, current, vacuum and ambient data on one timeline
- Process alerts
- Departures from the normal pattern recorded with severity and likely cause
- Operator action
- Warnings acknowledged, the process halted, and what was done kept on record
Analyze
Cycle-level analysis
A finished run is replayed in order, checking when the AI called it and what the sensors were doing.
- Replay by the second
- Temperature, vacuum, process step and logs synchronised on one timeline
- Replayed in 3D
- Equipment and product state played back in three dimensions
- Tracing the cause
- Detection scores compared against sensor movement to shortlist the cause
Measure
Process KPI analysis
Equipment, process, yield and quality measures are analysed to show how close you are to target and what to fix first.
- Key measures together
- Equipment, energy, process and quality performance against target
- Overall diagnosis
- The weak measures are found and put in order of priority
- Comparing cycles
- Performance by period and cycle, and whether the recommendation actually helped
Operate
Managing the models
Accuracy and versions managed through an MLOps practice, with retraining as needed.
- Models and data
- Training data, model versions, accuracy and where each was used
- Retraining on feedback
- Confirmed normal and fault verdicts decide when to retrain
- Verified before it goes live
- Compared against the current version; only an approved model goes in
Why AI
AI finds the warning signs sooner — and says what to do
The small drifts, the causes and the right time to service — the things a threshold alarm alone tends to miss.
| Aspect | Threshold-based monitoring | QFactory manufacturing AI |
|---|---|---|
| Anomaly detection | Alarms once a fixed limit is passed — after the fact | Learns the normal pattern, then catches small departures early |
| Finding the cause | Someone traces the logs by hand | Generative AI answers with likely causes and remedies |
| Process settings | Fixed recipe kept in place | Profiles recommended from condition and quality data |
| Maintenance | By interval, or after failure | Predictive maintenance from remaining useful life |
| Operation | Tuned by hand, then left alone | Data shifts watched, models retrained |
Ideal Use Cases
It suits plants like these
For plants dealing with the kind of drift an alarm never catches.

Lines that manage quality on threshold alarms alone
Slow decline inside the normal range goes unnoticed, and the problem only shows up downstream
Processes that rest on an experienced eye
Heat treatment and assembly, where quality shifts when the operator changes
Continuous lines where a stop is a loss
Round-the-clock plants that can only schedule maintenance if they know when it will fail